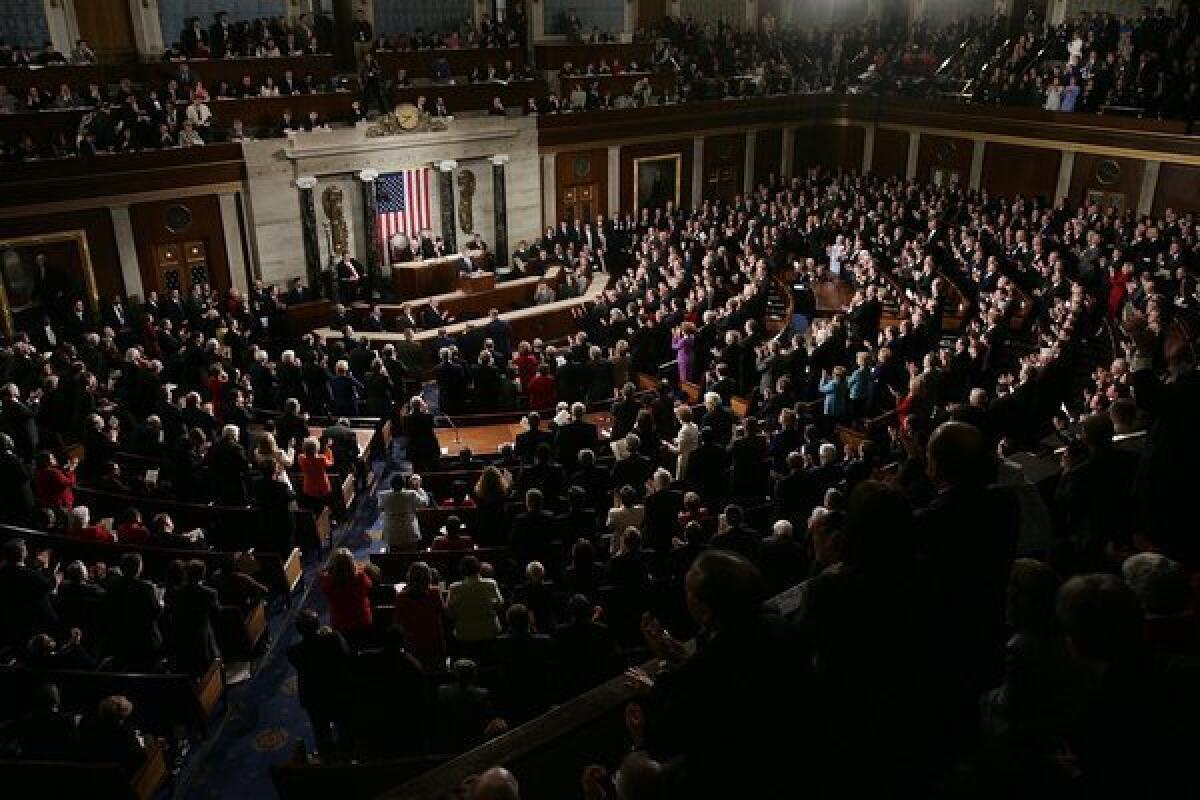
The best Congress money can buy

- Share via
As if the consequences of the Supreme Court’s 2010 Citizens United ruling weren’t already clear, four graphs released Wednesday provide a compelling visual to stand beside the piles of mounting evidence.
See here: Non-Party Independent Expenditures in House and Senate Elections, 1978-2012
For candidates in both parties, the trend line was ticking up years before the court ruled in Citizens United that the government had no role in limiting the political speech of corporations. The result was that it freed up organizations, such as corporations or labor unions, to influence elections through spending unlimited amounts of money on independent expenditures.
Though Citizens United is not the only factor accounting for the influx of money, it has undoubtedly served as a catalyst. In addition to the graphs released by the Brookings Institute, just look at the totals for nonpolitical independent expenditures in congressional elections:
House:
1980: $694,248
2008: $25,955,811
2010: $97,828,711
2012: $197,914,377
Senate:
1980: $1,684,102
2008: $17,775,352
2010: $97,243,604
2012: $259,301,100
Regardless of where you fall on the Supreme Court’s logic in the case, it’s difficult to deny the effect. In the years before Citizens United, total spending never increased by a margin of $50 million or $160 million (see Senate between 2010 and 2012). There was one instance in 2006 when spending increased about $20 million. But that can largely be attributed to an increased fundraising effort on the part of Democrats looking to take back the House. Total House spending stayed the same during the next cycle.
Citizens United is hardly entirely responsible for creating the problem of ballooning campaign spending. As Harvard Law professor Lawrence Lessig noted:
We need to remember that on January 20, 2010 -- the day before Citizens United was decided -- our democracy was already broken. Already, Congress was dependent upon its funders, yet the funders were not “the People.” Already, the tiniest slice of the 1 percent exercised an extraordinary power over the government. Citizens United no doubt made things worse. But even if it shot the body of this democracy, that body was already cold.
The new data are merely one piece of the puzzle. Before the last presidential election, it was widely reported that spending would hit $6 billion. Increased political spending has made television stations in swing states enticing buys. Campaign fundraising has become such a pervasive activity that the day after the 2012 election, Senate Minority Leader Mitch McConnell (R-Ky.) held a fundraiser for his reelection exactly two years later. This is bipartisan, though. Rep. Kurt Schrader (D-Ore.) held one later that weekend.
It’s true that some of this spending comes from smaller donors. But the fact remains that the large chunk of it often hasn’t. From Lessig in March 2012:
0.26 percent of Americans give more than $200 in a congressional campaign; .05 percent give the max to any congressional candidate; .01 percent -- the 1 percent of the 1 percent -- give more than $10,000 in an election cycle; and .0000063 percent -- have given close to 80 percent of the super PAC money spent in this election so far. That’s 196 Americans, a little less than the capacity of a single Boeing 767.
There’s no clear solution to this problem. Increased transparency is always a good idea, but it is not a replacement for a more permanent fix. Still, that doesn’t mean we shouldn’t turn our attention to it. Until then, spending will continue on its rising trajectory.
ALSO:
Goldberg: Obama wings it in Egypt
Obamacare glitch may cost young smokers, spare older ones
Safest seats in an air crash: They’re not where you might think
Twitter: @danielrothberg
More to Read
A cure for the common opinion
Get thought-provoking perspectives with our weekly newsletter.
You may occasionally receive promotional content from the Los Angeles Times.


